Curating Data
* The Curating Data course is part of the Critical Data Studies programme at Aarhus University in Denmark. The course draws on Arts and Humanities methods where study of data accounts for their social but also material and digital properties, and where questions of 'what', 'who', 'when', 'why' and 'how', are part of critical enquiries into histories and contemporary practices of science, data and curating.
Curating Data is part of an emerging field of practice-led inquiry into data as subject/object/process of knowledge making. It is about exploring structures that already exist in data science (data sets, databases, data points) and speculating with critical taxonomies making and forms of collecting, archiving and display which are exploratory and experimental. In Curating Data the focus is on data as relational and entangled, and as situated as part of extractive histories of knowledge making in the Western World.
Curator Okwui Enwezor said that curating is about participating in and witnessing histories as they unfold. What histories unfold when they are told with data and when they are about data? And how to communicate them? How to make sense of data and what they can tell us? If, as Donna Haraway says, situated knowledge is embodied, locatable and responsible, how to give shape to data as situated? And how to account for shadow genealogies of datafication and digitization, where surveillance and platform-based data practices organise data and claim them as facts? These practices remain for most part invisible and often inaccessible, and rarely possible to be held to account as they are continuously updated and changed. These questions asked about data in light of Enwezor's statement, point to the tension upheld by differences between participation and witnessing, and the need to occupy these positions simultaneously when engaging with data of all kinds.
This online exhibition is a selection of curated data as work-in-progress by students of Curating Data course* at Aarhus University in Denmark during autumn semester of 2020. While this was a second semester during COVID pandemic we were able to meet in-class and work together while following safety guidelines for pandemic situation. During the semester we explored histories of science and museums along data practices such as data management and organisation including: digitization, data sets creation, datafication, machine vision, taxonomies, categorisation, visualisation. We created tables and digital shelves for display and storage of data.
Students' projects present stories told with data which they gathered, digitized, downloaded and processed during the course. These activities were organised as a set of four assignments which asked: 1) to digitize a collection of things and generate a data set, 2) to create a data-selfie, 3) to collaboratively create classification system based on collective tagging (folksonomy), 4) to write a curatorial statement that frames the projects developed this semester in the context of themes discussed and texts read. Some of the forms and formats used to curate this data and information include timeline, poems, manifesto, game, language, folders, and files. While they are result of making sense of data in its many formats through practice of data curating, students situate their knowledge as they participate in data cultures and witness data histories through collecting, categorising, archiving and displaying data. And in the process of curating, they index how humans and nonhumans (data, algorithms, computational and Internet infrastructures, etc.) are part of knowledge making.
Data Curating collection of students' projects is organised here as a repository of web addresses listed alphabetically, and a tag cloud based on keywords and concepts that feature in each project. These two formats URL (Uniform Resource Locator) and Tag are used here to curate information and data. At the same time they exemplify some of the ways in which data is organised on the web, situating data and information generated by students as part of digital infrastructures and cultures, and knowledge making practice.
The collection is presented with the use of hotglue.me, a visual tool for creating websites directly in the web-browser. Developed by artists and programmers Danja Vasiliev and Gottfried Haider, the tool is not only an alternative to Wordpress or similar content management system applications, but it encourages to question the distinction between content and design, and facilitates working directly with material properties of the digital.
https://curatingdata.broholttrans.dk/
https://curatingnicolas.hotglue.me/
https://datajoe.hotglue.me/
https://docs.google.com/presentation/d/1IK67E4pgFlU5rK-gW9KreoIHTVx7D9hCOErmd24CMjg/edit#slide=id.p
https://docs.google.com/presentation/d/1KVnJDOsnNug
https://hackmd.io/@trip-trap/curatorial-presentation#/
https://lasse1.hotglue.me/
https://padlet.com/merkjaergaard/vx2qbcjmkch9r4zg
https://pootin.hotglue.me/
https://docs.google.com/presentation/d/15AOOtGYPD4
http://vindvind.eu/curatingdata
https://xd.adobe.com/view/7a04cc11-86f6-43ff-969a-1ce47e2dbfda-2f57/?fullscreen

Tag defines a link between online content and it is a form of classification, a keyword that once assigned to a piece of information becomes its metadata. In 2000s tagging became social practice facilitated by the growth of Web2.0 technologies such as blogs, image sharing and other socio-technological networks. Not only accessibility of content increased but also classification of information became a common practice among internet users, known as folksonomy. Today social tags and tagging are part of automated and increasingly AI based internet infrastructures.
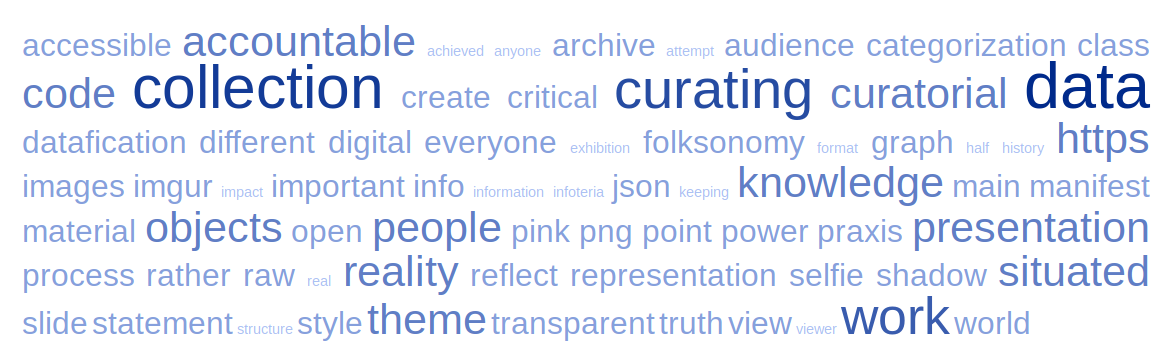
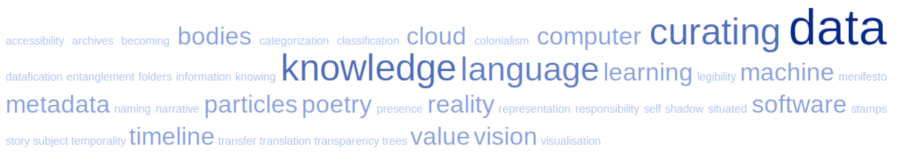
Classical form of tag representation is a word cloud where font size or colour indicate prominence of the term in the text source.
Here the word cloud is visually organised into three parts:
the TOP one is a list of human curated keyterms assigned to each project in the collection and then processed with web application TagCrowd.
The BOTTOM cloud was generated with TagCrowd crowler which reads the web document at each address (except for web documents on google, adobe and padlet) and extracts the text only. Wordcloud was created for these web documents and aggregated words were then processed with TagCrowd resulting in the version presented here.
The MIDDLE cloud is an aggregation of keyterms from the TOP and BOTTOM clouds, which do not repeat in the other. Here difference is used as a measure which reveals values assigned to keyterms which normally would have featured less prominently in word cloud representations. Statistical and qualitative methods when combined offer a 'horizontal' hierarchy where each keyword has the same weight/value while the cloud offers another way of generating maningful metadata. .
LINKS
posthuman practices of knowledge making
TAGS
Students/data curators:
Adam Naldal, Benjamin Havemann Collins, Freya Wattez, Jeppe Mark Vind, Johanne Frost Lunding, Kasper Curran Vestergaard, Lasse Bødker Daabeck, Lukas Wrobel, Martin Broholt Trans, Me Raunkjær Kjærgaard, Nicolas Hansen, Nina Galsgaard, Nis Repenning, Sigurd Vemmelund Jørgensen
Invited guests:
Birgitte Bergmann Collections Manager, Herbarium Aarhus University
Martino Morandi, Infrastructural Manœuvres at Rietveld and Sandberg Library in Amsterdam
Nana Bonde Thylstrup, Associate Professor Copenhagen Business School
Roel Roscam Abbing, artist and PhD candidate, in Interaction Design at Malmö University
Pablo Velasco, Assistant Professor Aarhus University
Winnie Soon, Associate Professor Aarhus University
Course Lecturer/collection curator:
Magda Tyżlik-Carver, Assistant Professor Aarhus University
contact: magdatc@cc.au.dk
November 2020, Aarhus
URL or Uniform Resource Locator is a form of URI (Unique Resource Identifier). It follows standard naming convention for accessing documents available on the Internet.
The list below consists of 14 URLs generated by the students when creating their curated projects. Here organised alphabetically, the URLs reveal location of data as part of HTTP protocols, domain and subdomain names, directories and files. These links show what tools have been used for organising data, and they offer unique aesthetics for rendering data. While the links themselves can be studied giving also insight into mundane practices of naming, once visited they open to worlds of data connections and relations studied by their authors.
All the pages are work in progress! More will be added.
https://datagurd.hotglue.me
https://docs.google.com/presentation/d/1ms9KS-lsBY8A